
Manthan Patel
Here are the Projects, Dashboards and Blogs that I have made/written…
Blogs:
1. TFOD Installation & Object Detection with Pre-Trained Model
- A Blog about How to do installation of TF-1 OD and Object Detection with Pre-Trained TF-1 Model.

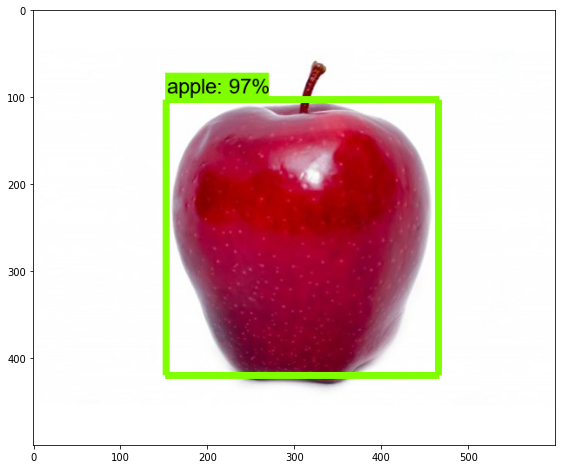
2. Building Custom Model using TFOD Pre-Trained Model Weights
- A Blog about How to Prepare Annotated Dataset & How to train your own custom model for fruit detection using pre-trained model weights.
Projects
Project 12: Mask Detection with Person Identification:
- Project is a combination of Object detection model and Image classification model, to detect person with no mask and identifying that person to store the data in a downloadable csv file with UI.
Project 11: Product Ingredients Label Checker:
- For the project, I have done a research on most common harmful and natural ingredients which are used in the Shmapoo.
- The Project is a combination of OCR + Text Scraping + Image Scraping + Study regarding common harmful & natural Ingredients in Product
Project 10: Cloths & Accesory Classification:
- This project is built for classifying total 10 different type of cloths and accessories with VGG Image Classification Model.
Project 9: 2020 Kaggle Machine Learning & Data Science Survey :
- This is Kaggle’s annual Machine Learning and Data Science Survey competition for presenting a story of the data science community.
Project 8: COVID-19 Detection (X-ray Images):
- Dataset of X-ray Images are taken from Kaggle
- Here, I have manually chosen images of Covid-19 and Normal State.
- Entire model is trained on total around 400 images.
- For testing, I have used around 50 images.
- A Proper explanation of model is also given.
- Note: Purpose of this test project is to learn how to build a CNN model. It does not claim any guarantee of anything.
Web App on Heroku
Project 7: Data Extraction of Movies/TV Shows:
- Here, I have used bs4 (BeautifulSoup) library for Extracting Movie/TV Show Data.
- MongoDB is used to store the data in database.
- Information like ‘Title’,‘Time Period’,‘Rating’,‘Genre’,‘Duration’,‘Votes’,‘Directors’,‘Stars’ and ‘Description’ are extracted.
- These information are collected for 60,000+ Movies/TV Shows.
-
For more understanding of the project, refer IMDB-Movies(60000)-Web-Scraping.ipynb
- Finally, I have created Data Visualization with PowerBI for this data.

Project 6: Website Checker
- The Dataset has 2453 rows and 31 columns.
- It has 31 columns: ‘having_IP_Address’, ‘URL_Length’, ‘Shortining_Service’, ‘having_At_Symbol’, ‘double_slash_redirecting’, ‘Prefix_Suffix’, ‘having_Sub_Domain’, ‘SSLfinal_State’, ‘Domain_registeration_length’, ‘Favicon’, ‘port’, ‘HTTPS_token’, ‘Request_URL’, ‘URL_of_Anchor’, ‘Links_in_tags’, ‘SFH’, ‘Submitting_to_email’, ‘Abnormal_URL’, ‘Redirect’, ‘on_mouseover’, ‘RightClick’, ‘popUpWidnow’, ‘Iframe’, ‘age_of_domain’, ‘DNSRecord’, ‘web_traffic’, ‘Page_Rank’, ‘Google_Index’, ‘Links_pointing_to_page’, ‘Statistical_report’, ‘Result’
- From the Dataset, we have to predict is the website Phishing website or not.
- ExtraTreesClassifier has been used for Feature Selection.
- I have applied Artificial Neural Network, Random Forest, Decision Tree, K-NN, Naive bayes classification, Logistic Regression and SVM algorithms but at the end, RandomForestClassifier gave better results.
Web App on Heroku: The Project is no longer available on Heroku
Project 5: House Price Prediction (Kaggle)
- This is a Kaggle Competition Project.
- Train and Test Dataset have almost same no. of columns and rows (1460,81).
- Various Techniques like Target Guided Encoding, logarithmic transformation technique, StandardScaler. Hyperparameter-tuning etc. have been used.
- Algorithms like RandomForestRegressor, Linear Regression, SVR, GradientBoostingRegressor and ANN have been applied.
Project 4: Restaurant Review Sentiment Analysis
- Dataset has 10000 rows and 8 columns.
- We have to predict whether a review is “Positive” or “Negative”.
- PortStemmer method has been used for Stemming.
- I have also tried WordEmbedding with LSTM.
- I have applied many different algorithms LSTM, Bi-Directional LSTM, RandomForestClassifier, MultinomialNB, SVM and KNN.
Web App on Heroku
Project 3: Spam Classifier
- Message and its final output is separated by Tab space.
- From the Dataset, we have to predict the label column:
- PortStemmer method has been used for Stemming.
- I have applied many different algorithms RandomForestClassifier, MultinomialNB, SVM and KNN.
Web App on Heroku
Project 2: Titanic Disaster
- The Dataset has “PassengerId”, “Survived”, “Pclass”, “Name”, “Sex”, “Age”, “SibSp”, “Parch”, “Ticket”, “Fare”, “Cabin”, “Embarked” columns. It has total around 1300 rows and 12 columns.
- From the Dataset, we have to predict the Survived column:
- ExtraTreesClassifier has been used for Feature Selection.
- I have used Count/Frequency Encoding Technique for Feature Encoding.
- I have applied many different algorithms but at the end, KNN gave better results.
Web App on Heroku
Project 1: Alcohol Quality Checker
- The Dataset has ‘density’, ‘pH’, ‘sulphates’, ‘alcohol’, ‘Quality_Category’ columns. It has 4898 rows and 5 columns.
- From the Dataset, we have to predict the Quality of Alcohol: “High” or “Low”.
- ExtraTreesClassifier has been used for Feature Selection.
- I have applied Artificial Neural Network, Random Forest, Decision Tree, K-NN, Naive bayes classification and SVM algorithms but at the end, KNN gave better results.
Web App on Heroku
Dashboards
Dashboard 1: IMDB Movies/TV Shows Data
A Data Visualization For Extracted 60,000+ Movies/TV Shows Data.’ with Power BI.
Dashboard 2: UFC
I enjoy watching UFC fights so this was just for fun that I decided to explore UFC fights’ Data with Power BI.
Dashboard 3: US Police Violence & Fatalities
This Dashboard projects violence data in USA with Tableau.
Dashboard 4: Retail Analysis
Retail Data Analysis with Power BI.
Number 1: Summary
Number 2: Detailed
Dashboard 5: HR-Analytics
Dashboard is abount Employee and their Satisfaction with their work with Power BI.

Dashboard 6: COVID-19
This Dashboard was created few months back to understand cases of Covid-19 all over the world with Tableau.
Dashboard 7: Occupation Analysis
A Dashboard for Occupation Analysis with Tableau.
Dashboard 8: Sales Analysis
A Dashboard for Sales Analysis with Tableau.
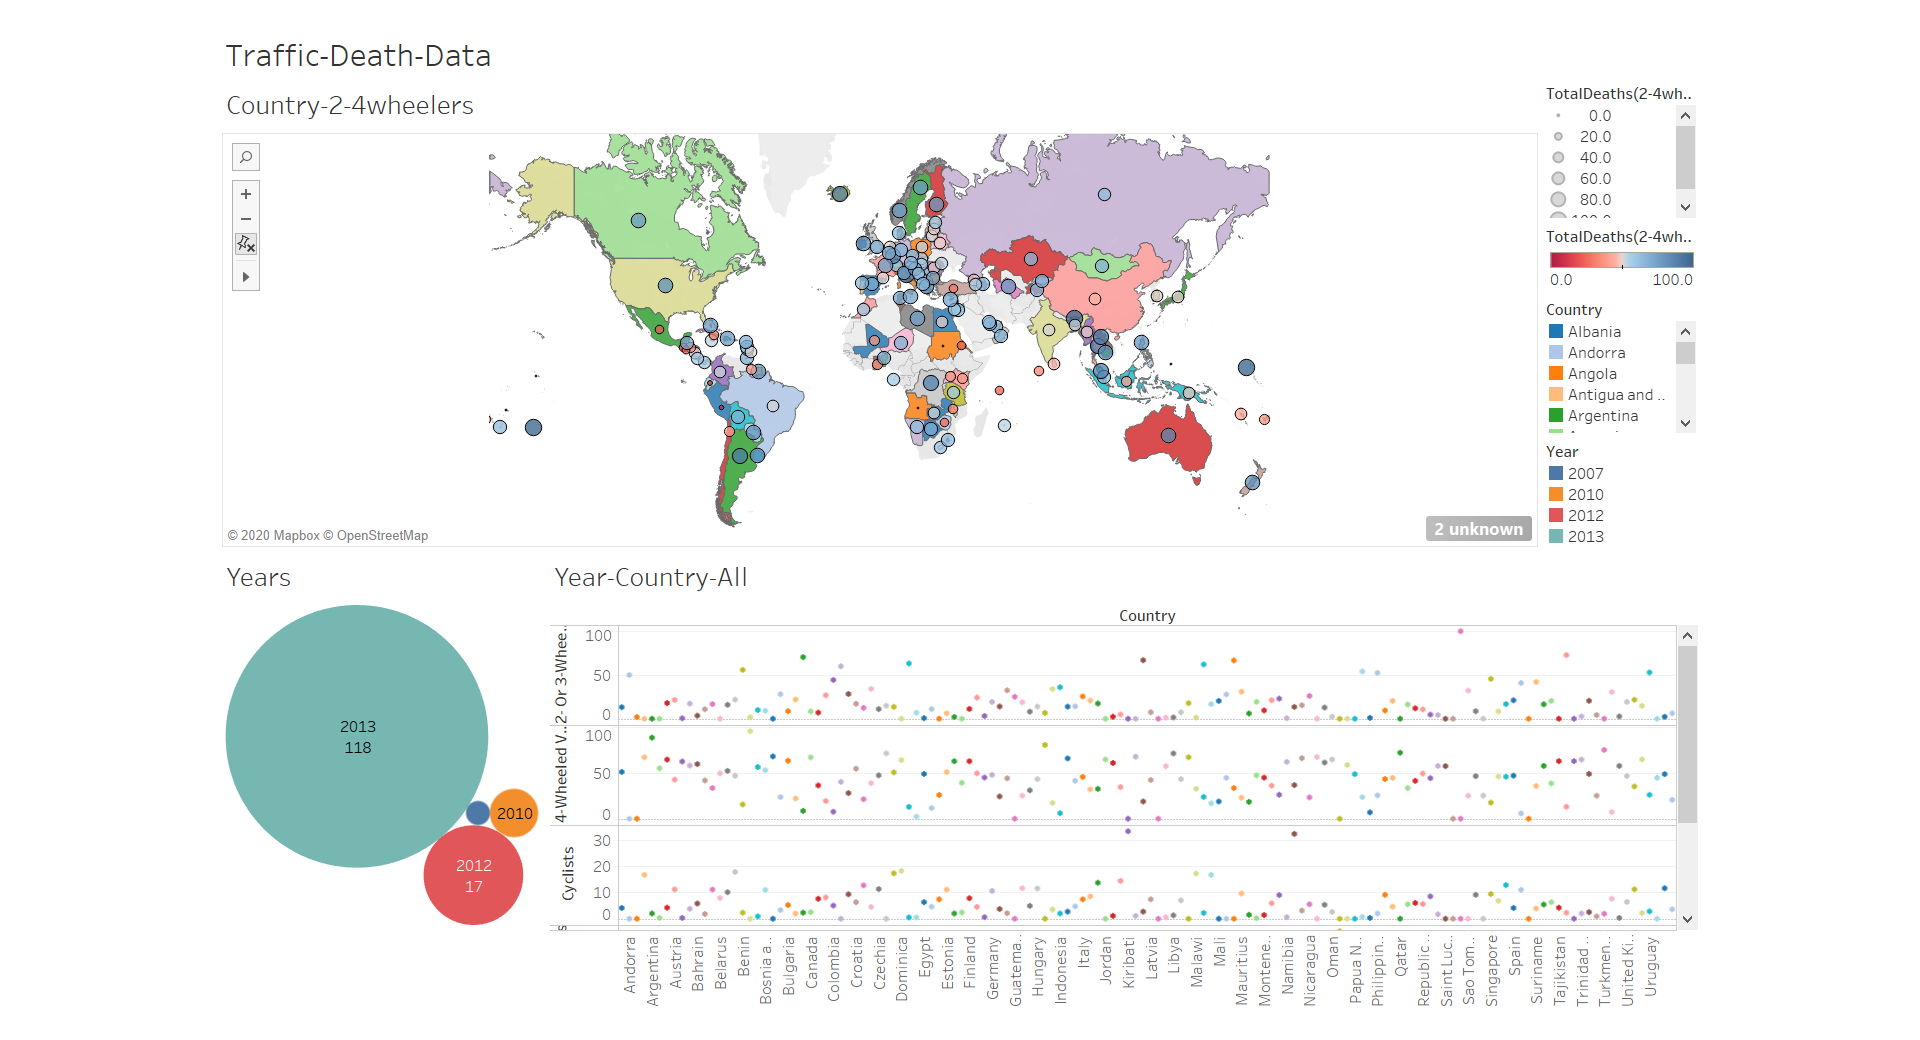
Dashboard 9: Traffic-Deaths
A Dashboard about Traffic Deaths all over the world with Tableau.
Giving Back To Community
Instagram Account
Contact Information
LinkedIn: linkedin.com/in/manthanpatel987/